
BIL INVESTMENT INSIGHTS

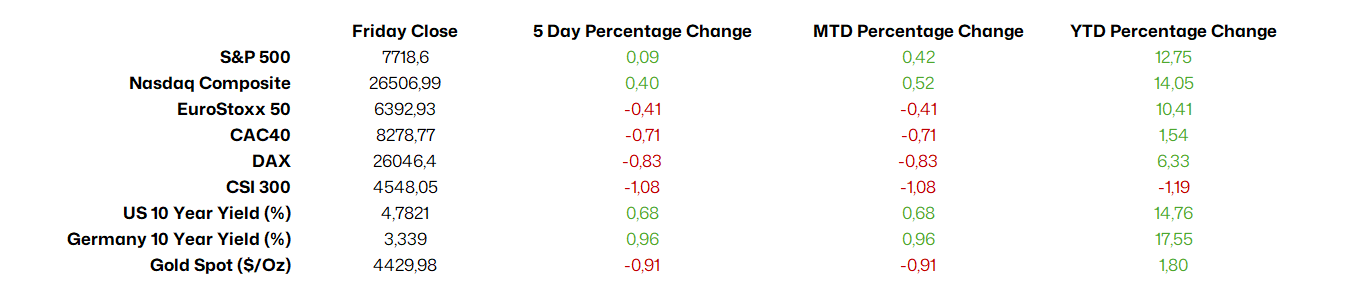
At the onset of last week, the sell-off in global bonds intensified. UK borrowing costs hit their highest level since 2008, while Japan's rose to levels unseen since the 1990s. The US 10-year Treasury yield flirted with 4.8%.
The rise in yields reflects several dovetailing factors, including persistent fiscal deficits and elevated corporate issuance, particularly as companies seek to fund the AI buildout. Last week, however, geopolitics appeared to take centre stage. Much of the upward move came after tensions flared again in the Middle East, with Brent crude rising above $96 per barrel and European natural gas prices touching a three-year high.
Until now, the global economy has been shielded from the full impact of the energy shock through the release of strategic reserves, inventory drawdowns and government support measures. However, these buffers are finite, and markets are increasingly reassessing inflation risks. Investors are beginning to price in the possibility that central banks may need to tighten further, to contain price pressures.
This is yet another factor making it difficult for long-term bond yields to find a stable anchor. For investors, the challenge is balancing two competing forces: higher interest rates, which could weigh on equity valuations, and a backdrop of resilient economic growth and exceedingly strong corporate earnings, as discussed in the final section.
On Thursday, Fed Governor Waller offered bond markets some relief, stating that he would support keeping interest rates unchanged at the FOMC meeting on 15-16 September, provided incoming inflation data did not surprise to the upside. However, the respite proved short-lived. A stronger-than-expected jobs report on Friday prompted investors to increase their bets on a Fed rate hike. Equities came under pressure, while shorter-dated Treasuries underperformed.
The outcome of the week was that, for now, all roads seem to lead back to inflation. Higher energy prices have revived concerns about future price pressures, while a resilient labour market and robust ISM PMI data give the Fed greater scope to prioritise its price stability mandate.
As we discuss in the final section, tackling inflation is becoming increasingly pressing, with many households across the US still grappling with a cost-of-living squeeze. The Fed's next move is seen as a coin toss between a hike and a hold; it will depend heavily on the CPI release due on Friday.
Here in the Eurozone, elevated inflation, discussed in more detail below, is widely expected to compel the ECB to raise its main policy rate to 2.5% on Thursday. The pan-European STOXX Europe 600 Index ended the week slightly lower.
Source: Bloomberg, BIL as of 7 September 2026
Macro Snapshot
Eurozone inflation hits 3.3% on higher energy costs
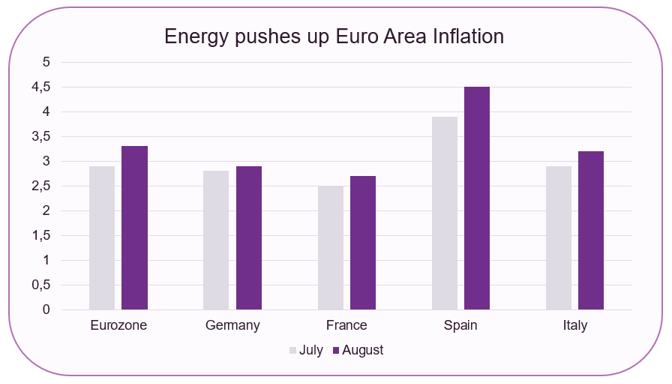
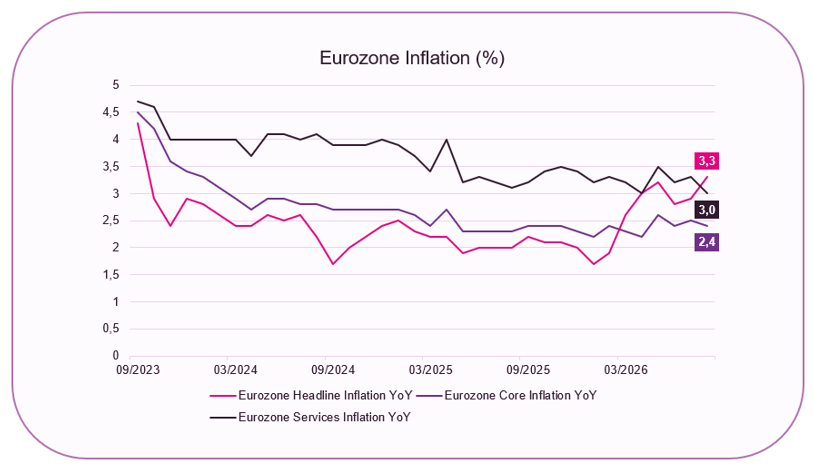
Eurozone headline inflation accelerated to 3.3% in August from 2.9% in July, in line with market expectations, according to flash estimates. It is the highest reading since September 2023, pushed up by the energy component, which rose 14.3% YoY, amid ongoing disruption in the Strait of Hormuz, a key conduit for oil and other petroleum products. Prices for unprocessed food and non-energy industrial goods also accelerated. Services inflation, which the ECB keeps a close eye on given that it tends to be stickier, eased to a four-month low of 3.0%. This suggests that cooler labour market conditions could be limiting the pass-through of higher commodity prices into wages and the broader economy. Core inflation, excluding energy and food, edged down to 2.4%, below forecasts of 2.5%.
Among the bloc’s largest economies, inflation accelerated in Germany to 2.9% from 2.8%, France to 2.7% from 2.4%, Spain to 4.5% from 3.9%, and Italy to 3.2% from 2.9%
The data strengthened expectations for a rate hike at the ECB's September meeting, with markets fully pricing a 25-basis-point increase to 2.5%. If the stalemate in the Middle East persists, another hike in December cannot be ruled out.
Source: Bloomberg, BIL
Source: Bloomberg, BIL
Data points to a broadly balanced US labour market – the Fed’s next move will depend on inflation
Last week, markets were given a fresh snapshot into the health of the US labour market.
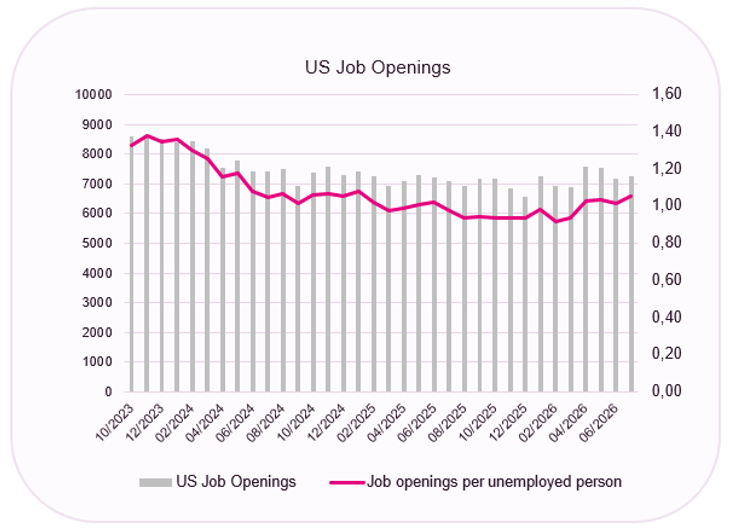
The number of open job positions increased by 89k to 7.271 million in July from a 7.182 million in June, below market expectations of 7.30 million. Durable goods manufacturing led the charge, with 76,000 new roles created, followed by health care and social assistance. The number of job openings now marginally exceeds the number of unemployed workers. This points to a more balanced situation than in the wake of the Covid pandemic, when there were two jobs for every jobseeker.
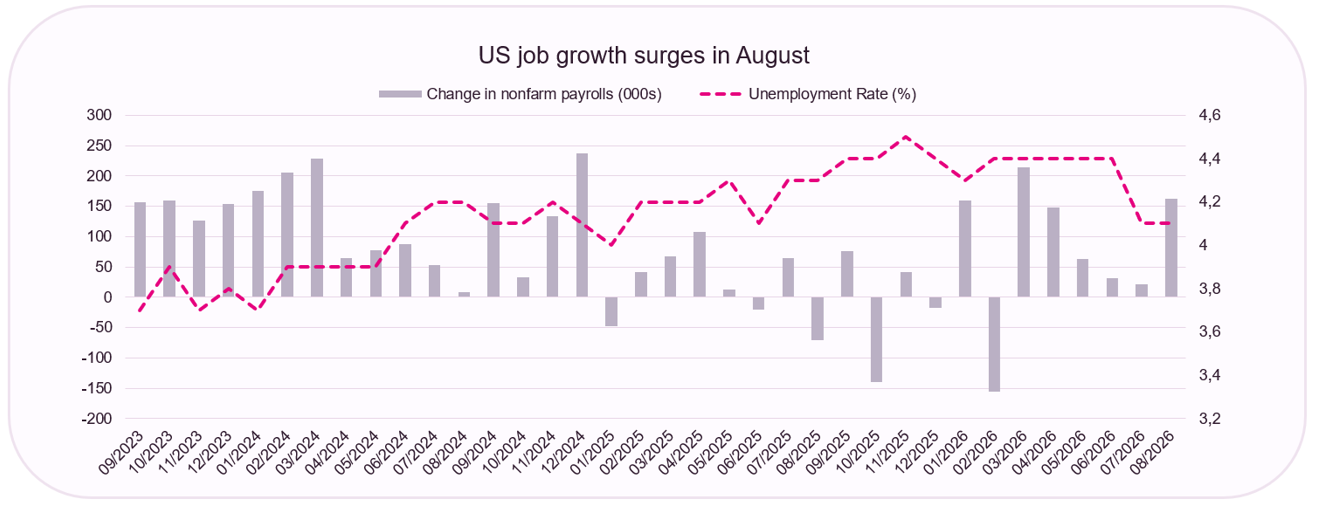
Friday’s jobs report saw actual job growth rise in August, while the unemployment rate held steady at 4.1%. Nonfarm payrolls increased by 162k – roughly triple economist expectations - and July’s job cuts were lost to revisions. Employment gains were particularly pronounced for eating out / drinking venues, local government education and manufacturing.
Source: Bloomberg, BIL
Source: Bloomberg, BIL
Looking beneath the bonnet and beyond the headlines about a "bumper" jobs report, we would still characterize the labour market as being in a broadly balanced state, rather than heating up. Average hourly earnings, for example, fell to 3.1% YoY, the lowest level since May 2021. Previously the Fed has indicated that a level of around 3% is consistent with its 2% inflation target. It’s also worth noting that wages are not, at this rate, keeping up with inflation. Annual PCE and CPI inflation sit at 3.3% and 3.4%, respectively.
So, while labour market strength - at face value - could embolden Fed hawks, next week’s inflation data will really be what moves the needle in the Fed's decision-making.
US ISM PMI confirms economic strength
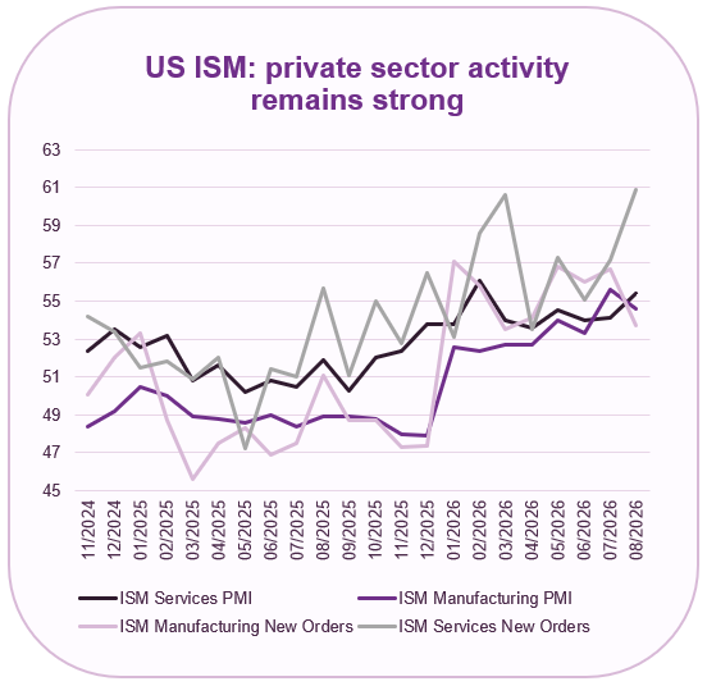
According to the latest set of PMIs, compiled by the ISM, US economic activity remained resilient through August, despite some moderation in manufacturing momentum. The Manufacturing PMI eased from a nearly four-year high of 55.6 to 54.6, but remained firmly in expansion territory for an eighth consecutive month. While new orders slowed noticeably, falling to 53.7 from 56.7, production growth remained robust at 58.3 and employment continued to expand, albeit at a more moderate pace. Input costs, however, remain a challenge for manufacturers. Supporting the survey data, the Federal Reserve's Beige Book reported that manufacturing activity increased across most districts, driven largely by demand for defense-related products and data-center infrastructure. Friday's employment report reinforced this picture, showing that manufacturing payrolls continued to grow, increasing by 16,000 over the month.
The services sector, meanwhile, continued to gather strength. The Services PMI rose to 55.4 from 54.1, marking its strongest reading in six months. Business activity, new orders and inventories all accelerated, pointing to solid underlying demand. Although backlogs increased, with some firms citing staffing shortages as a constraint, employment within the sector contracted. At the same time, inflation pressures intensified, with the prices-paid component rising to a four-year high of 72.6, driven in part by petroleum-related products. Taken together, the data suggest that US economic growth remains on a solid footing, although persistent cost pressures are likely to keep inflation firmly on policymakers' radar.
Source: Bloomberg, BIL
Another strong US earnings season draws to a close
In the US, the second-quarter earnings season is drawing to a close, with almost all S&P 500 companies having reported results. So far, 86% have delivered positive earnings surprises, while 77% have exceeded revenue expectations. Earnings growth has surpassed 33%, with the strongest contributions coming from the energy, communication services and consumer discretionary sectors.
While the technology giants continue to deliver impressive results, the more notable development is the breadth of earnings growth. Both the proportion of companies beating expectations and the magnitude of those beats are running above historical averages, pointing to a robust corporate environment. It may also suggest that the benefits of AI are beginning to extend beyond the companies building the technology, helping to boost productivity across corporate America at large.
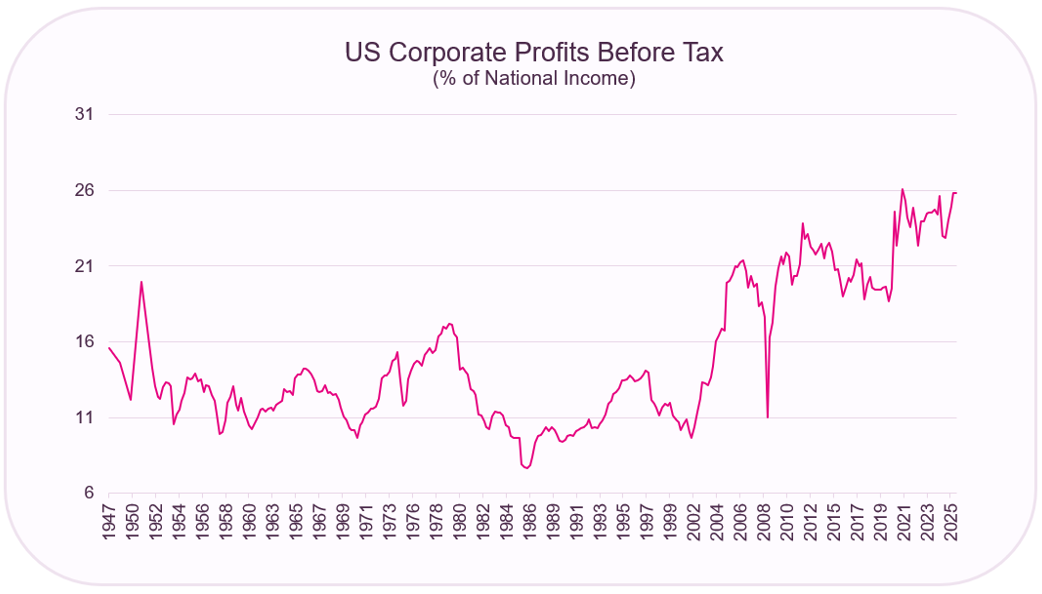
The chart below highlights another striking trend. US corporate profits as a share of national income are currently sit close to their highest levels of the post-WW2 era. The data reveals two distinct regimes: a declining profit share between 1950 and 1986, followed by a sustained upward trend from 1987 onwards. The post-pandemic period appears to represent a further step change, lifting profits onto a higher plateau.
The flip side of rising corporate profitability is a declining share of national income accruing to employees. Over time, this could weigh on consumption. So far, however, consumer spending has been supported by a powerful wealth effect, as rising equity markets and home prices have boosted the spending power of higher-income households.
At the same time, lower-income households continue to face pressure from elevated living costs and slower wage growth. Given that household consumption still accounts for roughly two-thirds of US economic activity, the Federal Reserve faces a delicate balancing act: containing inflation without undermining the growth that has supported both consumers and corporate profits.
Source: Bloomberg, BIL
Calendar for the week ahead
Monday – Eurozone GDP Growth (Q2, 3rd Estimate)
Tuesday – China Balance of Trade (August). Germany and France Balance of Trade (July). US NFIB Small Business Optimism. Spain Consumer Confidence.
Wednesday – China Inflation Rate (August). France Industrial Production. Italy Inflation.
Thursday – Germany Inflation (Final, August). Industrial Production. ECB Monetary Policy Decision. US Weekly Jobless Claims, PPI (August), Existing Home Sales. OPEC Monthly Report.
Friday – UK GDP (July). US CPI Inflation (August). Michigan Consumer Sentiment (Preliminary, September).
Disclaimer
All financial data and/or economic information released by this Publication (the “Publication”); (the “Data” or the “Financial data
and/or economic information”), are provided for information purposes only,
without warranty of any kind, including without limitation the warranties of merchantability, fitness for a particular
purpose or warranties and non-infringement of any patent, intellectual property or proprietary rights of any party, and
are not intended for trading purposes. Banque Internationale à Luxembourg SA (the “Bank”) does not guarantee expressly or
impliedly, the sequence, accuracy, adequacy, legality, completeness, reliability, usefulness or timeless of any Data.
All Financial data and/or economic information provided may be delayed or may contain errors or be incomplete.
This disclaimer applies to both isolated and aggregate uses of the Data. All Data is provided on an “as is” basis. None of
the Financial data and/or economic information contained on this Publication constitutes a solicitation, offer, opinion, or
recommendation, a guarantee of results, nor a solicitation by the Bank of an offer to buy or sell any security, products and
services mentioned into it or to make investments. Moreover, none of the Financial data and/or economic information contained on
this Publication provides legal, tax accounting, financial or investment advice or services regarding the profitability or
suitability of any security or investment. This Publication has not been prepared with the aim to take an investor’s particular investment objectives,
financial position or needs into account. It is up to the investor himself to consider whether the Data contained herein this
Publication is appropriate to his needs, financial position and objectives or to seek professional independent advice before making
an investment decision based upon the Data. No investment decision whatsoever may result from solely reading this document. In order
to read and understand the Financial data and/or economic information included in this document, you will need to have knowledge and
experience of financial markets. If this is not the case, please contact your relationship manager. This Publication is prepared by
the Bank and is based on data available to the public and upon information from sources believed to be reliable and accurate, taken from
stock exchanges and third parties. The Bank, including its parent,- subsidiary or affiliate entities, agents, directors, officers,
employees, representatives or suppliers, shall not, directly or indirectly, be liable, in any way, for any: inaccuracies or errors
in or omissions from the Financial data and/or economic information, including but not limited to financial data regardless of the
cause of such or for any investment decision made, action taken, or action not taken of whatever nature in reliance upon any Data
provided herein, nor for any loss or damage, direct or indirect, special or consequential, arising from any use of this Publication
or of its content. This Publication is only valid at the moment of its editing, unless otherwise specified. All Financial data and/or
economic information contained herein can also quickly become out-of- date. All Data is subject to change without notice and may not be
incorporated in any new version of this Publication. The Bank has no obligation to update this Publication upon the availability of new data,
the occurrence of new events and/or other evolutions. Before making an investment decision, the investor must read carefully the terms and
conditions of the documentation relating to the specific products or services. Past performance is no guarantee of future performance.
Products or services described in this Publication may not be available in all countries and may be subject to restrictions in some persons
or in some countries. No part of this Publication may be reproduced, distributed, modified, linked to or used for any public or commercial
purpose without the prior written consent of the Bank. In any case, all Financial data and/or economic information provided on this Publication
are not intended for use by, or distribution to, any person or entity in any jurisdiction or country where such use or distribution would be
contrary to law and/or regulation. If you have obtained this Publication from a source other than the Bank website, be aware that electronic
documentation can be altered subsequent to original distribution.
As economic conditions are subject to change, the information and opinions presented in this outlook are current only as of the date
indicated in the matrix or the publication date. This publication is based on data available to the public and upon information that is
considered as reliable. Even if particular attention has been paid to its content, no guarantee, warranty or representation is given to the
accuracy or completeness thereof. Banque Internationale à Luxembourg cannot be held liable or responsible with respect to the information
expressed herein. This document has been prepared only for information purposes and does not constitute an offer or invitation to make investments.
It is up to investors themselves to consider whether the information contained herein is appropriate to their needs and objectives or to seek advice
before making an investment decision based upon this information. Banque Internationale à Luxembourg accepts no liability whatsoever for any investment
decisions of whatever nature by the user of this publication, which are in any way based on this publication, nor for any loss or damage arising
from any use of this publication or its content. This publication, prepared by Banque Internationale à Luxembourg (BIL), may not be copied or
duplicated in any form whatsoever or redistributed without the prior written consent of BIL 69, route d’Esch ı L-2953 Luxembourg ı
RCS Luxembourg B-6307 ı Tel. +352 4590 6699 ı www.bil.com.
Read more
More
September 11, 2026
Weekly Investment Insights
The oil market was front and centre again last week, after Brent crude crossed the psychological $100 per barrel threshold. The war in the Middle...
August 31, 2026
Weekly InsightsWeekly Investment Insights
Strong earnings from a leading AI company lifted tech firms, and helped both the Nasdaq and the S&P 500 close the week higher, but smaller-cap...
August 24, 2026
Weekly InsightsWeekly Investment Insights
US gross national debt has climbed above $40 trillion, underscoring the growing fiscal challenges facing the world's largest economy. The increase reflects years of persistent...
August 17, 2026
Weekly InsightsWeekly Investment Insights
US Treasury markets were in focus last week as investors demanded higher compensation to absorb growing government borrowing needs. A $42 billion auction of...
August 10, 2026
Weekly InsightsWeekly Investment Insights
Last week, the S&P 500 surpassed USD 70 trillion in total market cap for the first time in history, while the technology-heavy Nasdaq recorded its...