
BIL INVESTMENT INSIGHTS

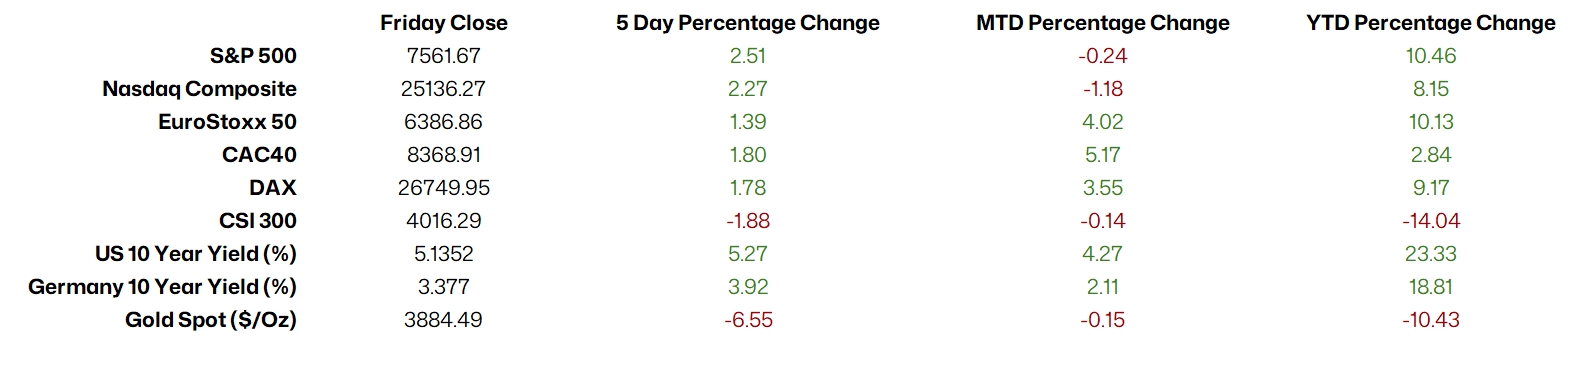
Markets navigated a volatile week as investors balanced shifting political expectations, the Nvidia-related controversy, fresh signs of persistent inflation pressures and hawkish central bank rhetoric. The dust settled on a Democratic sweep of Congress in the US midterm elections, prompting a reassessment of the fiscal outlook and the potential for tighter regulation of the technology sector. At the same time, October's inflation data came in firmer than expected, reinforcing concerns that the Federal Reserve's (Fed) battle against price pressures is not yet won and leading markets to price in the possibility of further tightening at its next meeting.
As a result, the rotation away from some of the year's best-performing AI stocks continued, while rising bond yields weighed on broader risk sentiment. The yield on the 10-year US Treasury note rose to 5.14% during the week. Despite the cautious backdrop, European equities continued to perform, with the STOXX Europe 600 reaching a fresh record high, supported by strength in mining and technology shares. Meanwhile, oil prices remained volatile after comments from Donald Trump regarding Iran added further uncertainty around the supply outlook. Overall, sticky inflation and hawkish central bank messaging remained the dominant themes, leaving investors focused on the path of interest rates and the implications for growth and financial markets heading into year-end.
Market Snapshot
Source: Bloomberg, BIL as of 16 November 2026
Macro Snapshot
US Inflation Exceeds Expectations
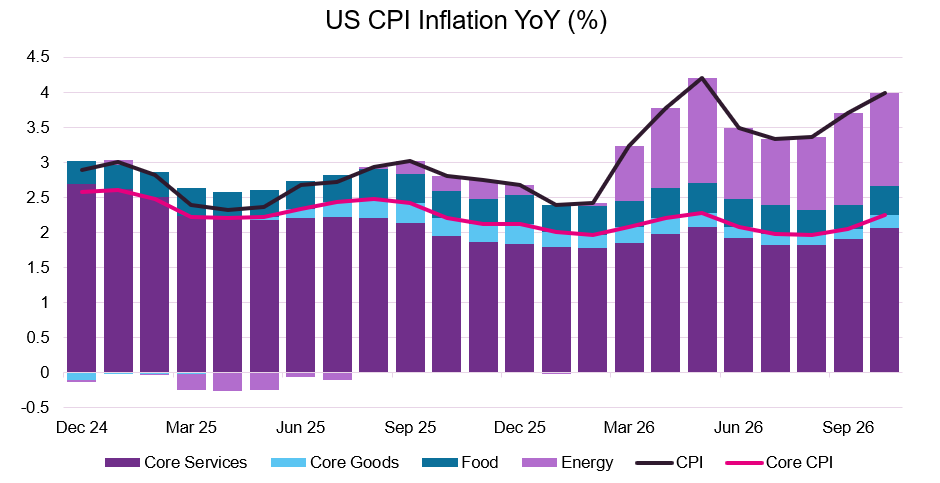
US CPI rose 0.4% month-on-month in October, moderating from 0.6% in September but still exceeding forecasts of 0.3%. Core inflation increased by 0.3%, above expectations of 0.2%. Shelter costs rose 0.3% and accounted for more than 30% of the overall increase in consumer prices. Food prices increased by 0.5%, while energy prices rose 0.7%.
At the same time, the labour market continues to show resilience; weekly jobless claims increased by 9,000 to 200,000 but remained well below historical averages.
Following the stronger-than-expected data, Fed Governor Christopher Waller suggested that a 50 basis point rate hike could be considered at the next Federal Reserve policy meeting. While such a large move remains unlikely, the data reinforced expectations that the Fed will raise interest rates by 25 basis points at its final meeting of the year.
Source: Bloomberg, BIL. As a result of the 2025 federal government shutdown, BLS did not collect October 2025 CPI data and did not publish an October report. Bloomberg has backfilled the missing values with Bloomberg-derived estimates, which are not official BLS figures.
Higher rates will continue to weigh on the already-struggling housing market. US existing home sales fell 5.5% in October to an annualised rate of 3.75 million, marking the weakest level since August 2010 and missing market expectations. Elevated mortgage rates continued to weigh on activity, with sales declining across most regions. Housing inventory increased to 5.1 months of supply, while the median home price rose 0.4% year-on-year to $416,700. Despite the weakness in sales, resilient house prices and rising inventory suggest the market is being constrained more by affordability than a lack of demand. Industry officials noted that lower mortgage rates could unlock significant pent-up demand, supporting a rebound in housing activity.
News regarding the fiscal trajectory wasn’t very encouraging. The US recorded a $27 billion budget deficit in September, compared with a $198 billion surplus a year earlier, as higher government spending outweighed rising tax revenues. The cumulative fiscal year 2026 deficit reached $1.99 trillion, underscoring the scale of US borrowing needs. Elevated debt issuance could keep upward pressure on Treasury yields, while continued fiscal spending provides support to economic growth despite restrictive monetary policy.
Cheaper oil offers relief, but not a reset for Europe
Brent crude fell back to around $95 per barrel last week. While prices remain vulnerable to geopolitical developments, the International Energy Agency (IEA) noted in a new report that the “oil market is showing tentative signs of rebalancing, with global oil supplies surpassing demand for the first time since the outbreak of the war in Iran”. Oil exports from the gulf now sit at 74% of pre-crisis levels, largely due to increased flows from Saudi Arabia and Iraq. The organisation also opined that the supply surplus could widen significantly next year. This raises an important question: who would benefit if oil prices continued to fall?
Europe should be among the main beneficiaries. As a major net energy importer, the region will certainly benefit from a lower import bill, freeing up income for households and businesses. The effect is less clear-cut in the US. Lower prices at the pump support consumers, but can also weigh on earnings, exports and investment across the country’s large energy sector. This could represent an adverse income shock for producers and energy-producing states such as Texas, New Mexico, North Dakota and Alaska.
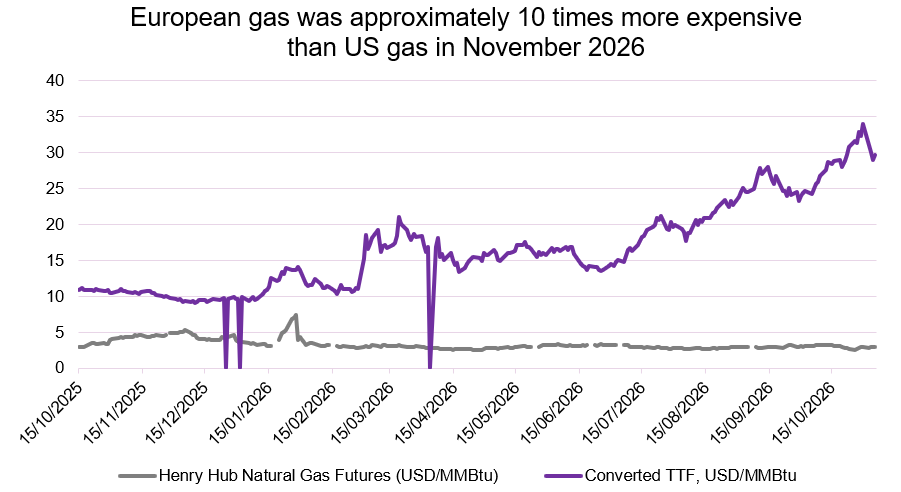
For Europe, however, oil is only part of the equation. The region’s industrial competitiveness depends more directly on natural gas and electricity prices, which remain elevated. By contrast, abundant and relatively cheap domestic gas was already a principal structural advantage for the US. The shale revolution, which gathered pace from the mid-2000s, unlocked vast domestic gas reserves through horizontal drilling and hydraulic fracturing, leaving US natural gas prices relatively insulated from global energy shocks.
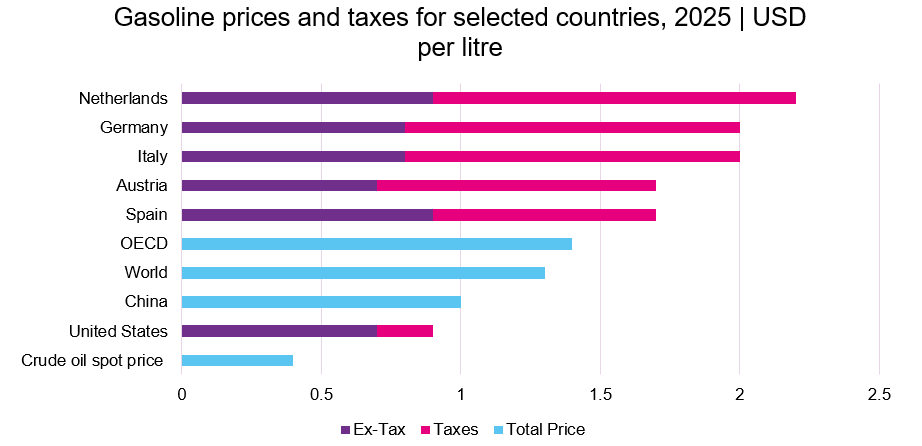
American motorists may also experience the impact of cheaper oil more visibly. European motorists benefit too, but high fixed excise duties and VAT mean that a given percentage decline in crude oil generally produces a smaller percentage reduction in the final pump price. IEA data illustrate this difference: US gasoline prices are substantially below those in major European economies, largely because taxes account for a much smaller share of the US retail price.
Meanwhile, elevated natural gas and electricity costs continue to pass through to European utility bills with varying lags. Eurozone inflation could therefore remain sticky in the months ahead, even if oil prices continue to decline.
From a growth perspective, cheaper crude would provide cyclical relief for the eurozone economy, but it would not remove Europe’s structural energy disadvantage. A more meaningful improvement would require natural gas and power prices to fall as well.
Source: Bloomberg, BIL as of 5/11/26, adjusted for energy units and exchange rates
Source: IEA, End-Use Prices Data Explorer. This is a work derived by BIL from IEA material. The derived work is not endorsed by the IEA or its Member countries in any manner. Note: Based on countries and aggregates for which data were available. Tax rates and other price components may have been adjusted since 2025. Figures are presented for illustrative purposes only.
Trade Deficit Deepens as Eurozone Momentum Fades
The Eurozone recorded a EUR 10.3 billion goods trade deficit in September, reversing a EUR 13.5 billion surplus from a year earlier and coming in well below expectations. Again, linking back to the region’s energy dependencies, the deterioration was driven largely by a widening energy deficit, with imports rising 16.1% while exports increased by a more modest 6.0%. For the first nine months of 2026, the region posted a €36.5 billion trade deficit, compared with a €102.2 billion surplus over the same period in 2025, highlighting the impact of higher energy costs linked to the conflict in the Middle East.
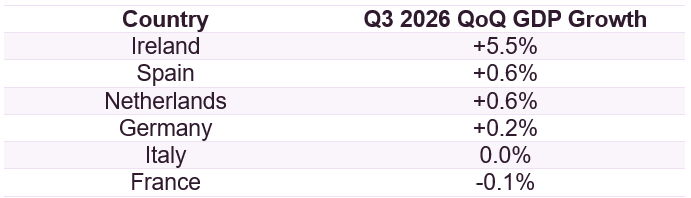
Eurozone GDP growth was confirmed at 0.4% quarter-on-quarter in Q3, representing a slowdown from 0.6% in Q2. Ireland was the significant outlier with 5.5% growth in Q3, though the Irish GDP is notoriously volatile because of the transfer pricing of large multinationals. Spain (+0.6%) and the Netherlands (+0.6%) were the strongest performers among the larger economies, continuing their recent outperformance within the bloc. France (-0.1%) was the notable drag, contracting for the second time in three quarters – consistent with its lowered full-year growth forecast of 0.5%.
Source: Bloomberg, BIL
Eurozone employment growth remained unchanged at 0.1% quarter-on-quarter in Q3. The data suggest that even as GDP momentum has slowed, the labour market continues to show resilience. Overall, the data point to a eurozone economy that is growing but losing momentum. Meanwhile, the sharp deterioration in the trade balance, driven by higher energy imports, could weigh on growth and keep inflationary pressures elevated, complicating the ECB's path towards further monetary easing.
UK Economic Growth Accelerates in Q3
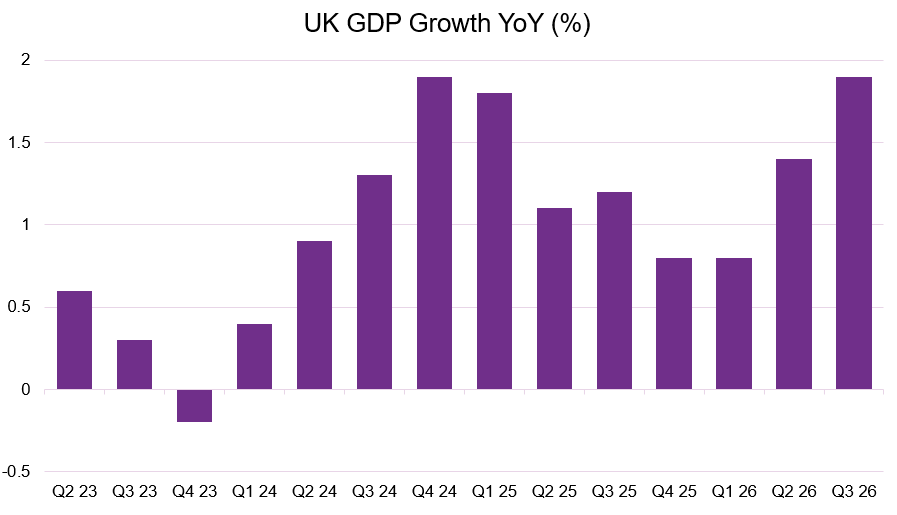
UK GDP grew 1.9% year-on-year in Q3 2026, according to preliminary figures, accelerating from 1.4% in Q2 and matching market expectations. Growth was driven primarily by the services sector, which expanded 2.3% and accounts for around four-fifths of the economy. Production output also increased 1.5%, although construction activity declined 1.7%. On the expenditure side, household consumption rose 1.8%, while government spending increased 1.6%. Overall, the data suggest that the UK economy maintained solid momentum during the quarter, supported by resilient consumer spending and continued strength in services activity.
Source: Bloomberg, BIL
Meanwhile, the UK's trade deficit widened to £5.13 billion in September 2026, its largest gap since April, as a 5.7% increase in imports outpaced a 2.7% rise in exports. Both imports and exports reached record levels during the month, highlighting robust domestic demand and continued external trade activity.
China Inflation
Inflation in China eased to 0.7% year-on-year in October from 0.9% in the previous month, coming in slightly below market expectations of 0.8%. The decline in food prices accelerated to -2.9% from -1.7% in September, while transportation costs rose to 5.3% from 4.3%. This marks the seventh consecutive month of food price deflation and the steepest decline this year, reflecting ample pork supplies and subdued consumer demand. Food accounts for almost a third of China's Consumer Price Index (CPI) basket, giving it a significant influence on the headline inflation rate. Overall, the latest data suggest that domestic demand remains subdued, reinforcing expectations for further policy support from Beijing.
China's trade surplus widened to $105.3 billion in October, up from $88.0 billion a year earlier, as exports rose 35.2% and imports surged 41.6%. Strong demand for Chinese high-tech products linked to the global AI infrastructure boom continued to support exports, while faster import growth and a narrowing surplus with the US reflected efforts to reduce trade imbalances. Year-to-date, China's trade surplus exceeded $1 trillion, keeping it on track to surpass last year's record level.
China's October trade data pointed to continued strength in global goods demand, particularly for AI-related technology products, while the surge in imports suggested resilient domestic demand. However, with China's trade surplus remaining near record levels, trade tensions with the US and EU are likely to remain an important risk.
Calendar for the week ahead
Monday – Japan GDP Growth (Preliminary, Q3). China Industrial Production, Retail Sales, Unemployment Rate (October). Eurozone Industrial Production (September).
Tuesday – UK Unemployment Rate (September). Eurozone, Germany ZEW Economic Sentiment Index (November). US Retail Sales, Industrial Production (October). Spain Balance of Trade (September). Italy Inflation Rate (Final, October).
Wednesday – Japan Balance of Trade (October). UK CPI Inflation (October). US Building Permits (Preliminary, October). US Crude Oil Inventories. US FOMC Minutes.
Thursday – US Initial Jobless Claims (November). Spain Consumer Confidence (October). Xi-Trump-Putin Summit.
Friday – Japan CPI Inflation (October). UK Retail Sales (October). UK Consumer Confidence (November). Germany PPI Inflation (October). Eurozone Consumer Confidence (Flash, November). France Business Confidence (November).
Disclaimer
All financial data and/or economic information released by this Publication (the “Publication”); (the “Data” or the “Financial data
and/or economic information”), are provided for information purposes only,
without warranty of any kind, including without limitation the warranties of merchantability, fitness for a particular
purpose or warranties and non-infringement of any patent, intellectual property or proprietary rights of any party, and
are not intended for trading purposes. Banque Internationale à Luxembourg SA (the “Bank”) does not guarantee expressly or
impliedly, the sequence, accuracy, adequacy, legality, completeness, reliability, usefulness or timeless of any Data.
All Financial data and/or economic information provided may be delayed or may contain errors or be incomplete.
This disclaimer applies to both isolated and aggregate uses of the Data. All Data is provided on an “as is” basis. None of
the Financial data and/or economic information contained on this Publication constitutes a solicitation, offer, opinion, or
recommendation, a guarantee of results, nor a solicitation by the Bank of an offer to buy or sell any security, products and
services mentioned into it or to make investments. Moreover, none of the Financial data and/or economic information contained on
this Publication provides legal, tax accounting, financial or investment advice or services regarding the profitability or
suitability of any security or investment. This Publication has not been prepared with the aim to take an investor’s particular investment objectives,
financial position or needs into account. It is up to the investor himself to consider whether the Data contained herein this
Publication is appropriate to his needs, financial position and objectives or to seek professional independent advice before making
an investment decision based upon the Data. No investment decision whatsoever may result from solely reading this document. In order
to read and understand the Financial data and/or economic information included in this document, you will need to have knowledge and
experience of financial markets. If this is not the case, please contact your relationship manager. This Publication is prepared by
the Bank and is based on data available to the public and upon information from sources believed to be reliable and accurate, taken from
stock exchanges and third parties. The Bank, including its parent,- subsidiary or affiliate entities, agents, directors, officers,
employees, representatives or suppliers, shall not, directly or indirectly, be liable, in any way, for any: inaccuracies or errors
in or omissions from the Financial data and/or economic information, including but not limited to financial data regardless of the
cause of such or for any investment decision made, action taken, or action not taken of whatever nature in reliance upon any Data
provided herein, nor for any loss or damage, direct or indirect, special or consequential, arising from any use of this Publication
or of its content. This Publication is only valid at the moment of its editing, unless otherwise specified. All Financial data and/or
economic information contained herein can also quickly become out-of- date. All Data is subject to change without notice and may not be
incorporated in any new version of this Publication. The Bank has no obligation to update this Publication upon the availability of new data,
the occurrence of new events and/or other evolutions. Before making an investment decision, the investor must read carefully the terms and
conditions of the documentation relating to the specific products or services. Past performance is no guarantee of future performance.
Products or services described in this Publication may not be available in all countries and may be subject to restrictions in some persons
or in some countries. No part of this Publication may be reproduced, distributed, modified, linked to or used for any public or commercial
purpose without the prior written consent of the Bank. In any case, all Financial data and/or economic information provided on this Publication
are not intended for use by, or distribution to, any person or entity in any jurisdiction or country where such use or distribution would be
contrary to law and/or regulation. If you have obtained this Publication from a source other than the Bank website, be aware that electronic
documentation can be altered subsequent to original distribution.
As economic conditions are subject to change, the information and opinions presented in this outlook are current only as of the date
indicated in the matrix or the publication date. This publication is based on data available to the public and upon information that is
considered as reliable. Even if particular attention has been paid to its content, no guarantee, warranty or representation is given to the
accuracy or completeness thereof. Banque Internationale à Luxembourg cannot be held liable or responsible with respect to the information
expressed herein. This document has been prepared only for information purposes and does not constitute an offer or invitation to make investments.
It is up to investors themselves to consider whether the information contained herein is appropriate to their needs and objectives or to seek advice
before making an investment decision based upon this information. Banque Internationale à Luxembourg accepts no liability whatsoever for any investment
decisions of whatever nature by the user of this publication, which are in any way based on this publication, nor for any loss or damage arising
from any use of this publication or its content. This publication, prepared by Banque Internationale à Luxembourg (BIL), may not be copied or
duplicated in any form whatsoever or redistributed without the prior written consent of BIL 69, route d’Esch ı L-2953 Luxembourg ı
RCS Luxembourg B-6307 ı Tel. +352 4590 6699 ı www.bil.com.
Read more