BIL INVESTMENT INSIGHTS

Market Snapshot
Major US stock indices ended last week in the red, as concerns that AI could have a disruptive impact on entire industries continued to drive the sell-off in the technology sector. Financial companies joined software and data firms in their concerns about the potential impact of AI on their businesses. Meanwhile, treasuries rallied, with the benchmark 10-year US Treasury note yield hitting a new year-to-date low amid pressure on equity markets.
We are about halfway through the Q4 2025 earnings season with 66% of US companies having reported and 45% in Europe. In the US, 77% of S&P 500 companies that have reported beat EPS estimates. EPS growth for these companies is at +12% y/y, surprisingly positively by 7%. Five out of eleven sectors are printing double-digit EPS growth, including Materials, Industrials, Financials, Tech and Communication Services. At the same time, Health Care has come in weaker.
In Europe, 57% of the Stoxx 600 companies that have reported have beaten EPS estimates, with EPS growth at +4% y/y, with a positive surprise of 3%. Results are quite mixed, with a number of sectors reporting negative EPS growth. Financials remain an outlier, having reported robust double-digit earnings growth.
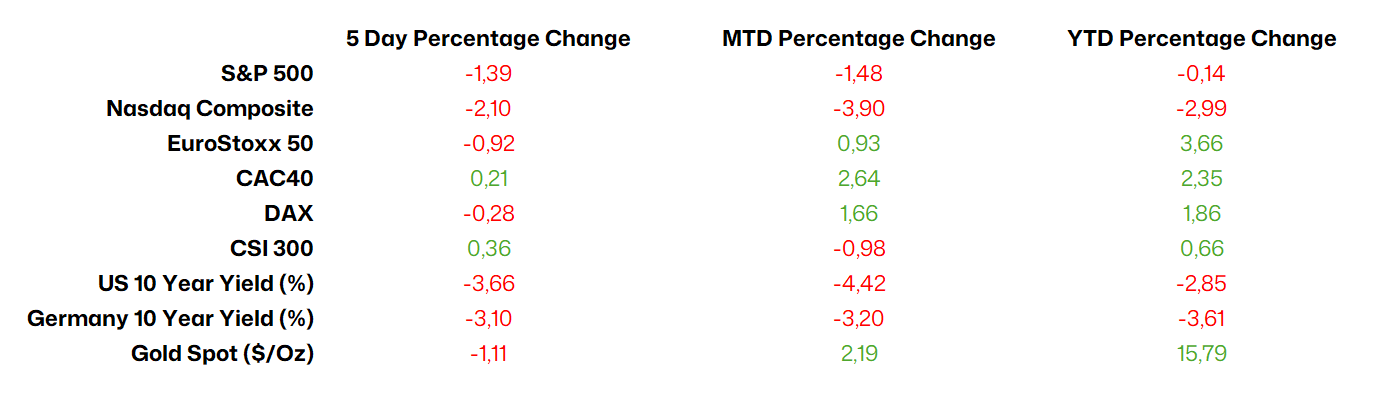
Source: Bloomberg, BIL as of February 16
Macro Snapshot
Who’s paying the tariff bill?
Over the course of 2025, the average tariff rate on US imports rose from 2.6 to 13%. According to a new study by the New York Fed, US importers and consumers are footing the bulk of this bill. The paper, posted on the Liberty Street Economics blog, writes that 94% of the tariff incidence was borne by the US in the first eight months of 2025, meaning that a 10% tariff, caused only a 0.6 percentage point decline in foreign prices.
By the end of the year, a larger share of the tariff incidence was borne by foreign exporters, but still only 14%.
Concurring with this conclusion, the non-partisan Tax Foundation found that the tariffs amounted to an average tax increase on US households of $1,000 in 2025 and $1,300 in 2026. With midterm elections scheduled for November 3rd and President Trump’s popularity floundering, he has floated the idea of issuing USD 2,000 “tariff dividends” to middle and lower income households. Whether these cheques materialise partly hinges on an upcoming Supreme Court ruling over the legality of tariffs and how importers might receive tariff refunds.
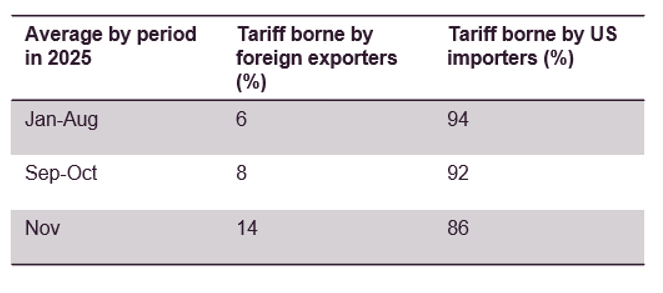
Source: NY Fed, US Census Bureau
Is the US labour market turning a corner?
Throughout much of 2025, the US labour market was stuck in a “low hiring, low firing” situation. A breakout on the downside of that pattern would put consumer spending and economic growth in jeopardy. Already, we are seeing a slowdown in Retail Sales, which did not grow in December, and data released last week looked ominous amid a sharp spike in layoffs (though the data was skewed by a few key names like UPS and Amazon), as well as the fact that job postings fell to the lowest level since 2020 in December (the pinch of salt is that severe weather likely interfered with hiring plans).
However, this week brought glints of optimism that the situation in the job market is stabilising, perhaps even turning a corner.
The unemployment rate fell from 4.4%, to 4.3%, even as the participation rate rose, and average hourly earnings came in stronger than expected at 3.7% YoY. Note that the Fed sees a reading of around 3% as being consisted with its 2% inflation target.
Nonfarm payrolls rose by 130k, double the 65k expected by markets, and up from 48k in December. It marked the highest number of jobs being created since Dec 2024, and that’s even with a negative skew from the delayed impact of Government job cuts. Federal payrolls dropped by 34k, with many employees who accepted deferred resignations in early 2025 falling off the books. Job gains were largely led by health care and social assistance; a healthy sign would be if this broadened out further.
So, all in all, quite a strong start to the year for the US job market. The market seems to believe that the data reduces the urgency for the Fed to lower rates, and expectations for a June rate cut were pushed out to July.
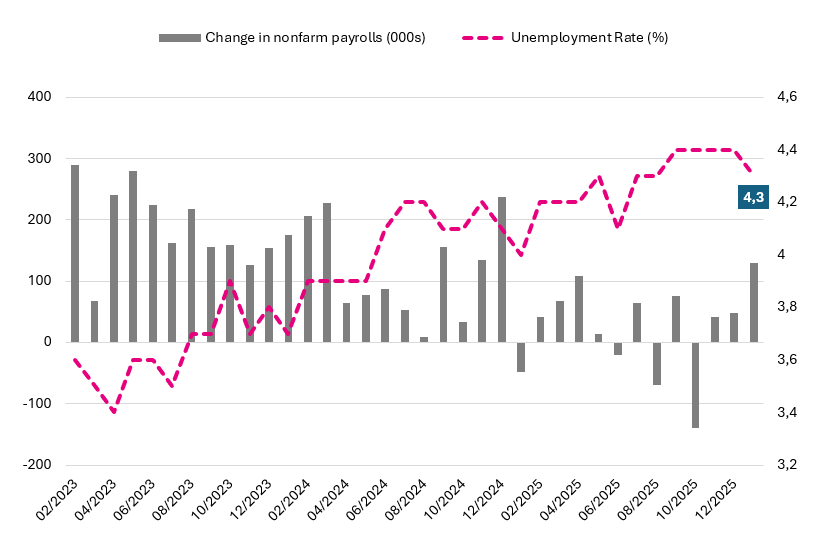
Source: Bloomberg, BIL
US inflation falls by more than expected in January
Consumer prices in the US increased by 2.4% in January, falling more than expected from 2.7% in December. The deceleration was largely due to base effects, however, as higher readings from a year ago disappear from the annual calculation.
Price pressures eased significantly in the energy sector (-0.1%, from 2.3% in December), driven down mainly by gasoline and fuel oil. Prices for used cars and trucks fell, while inflation for food and shelter slowed. Core inflation, which excludes volatile categories such as food and energy, eased to 2.5%, the lowest reading in nearly five years and compared with 2.6% in the prior month.
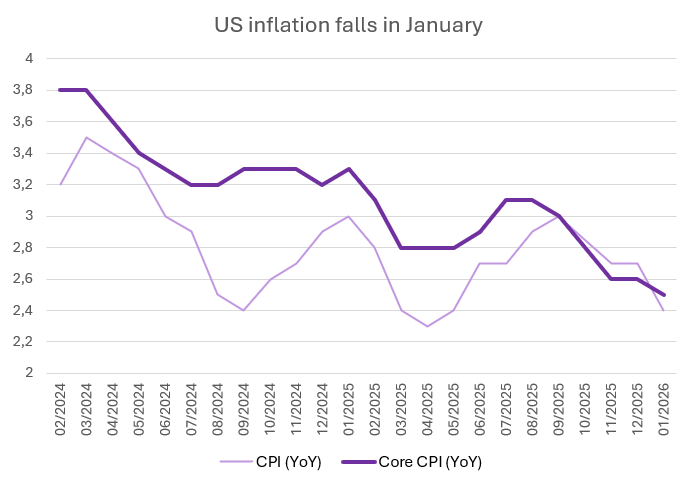
Source: Bloomberg, BIL
With price pressures easing, investors slightly increased their bets on interest rate cuts by the Federal Reserve. However, a first cut this year is still only fully priced in for July.
Chinese house prices continue to fall and inflation eases
At the start of the year, new home prices in China fell further, dropping by 3.1% year on year in January, compared to a decline of 2.7% in December. This marks the sharpest drop since June last year, highlighting the ongoing downturn in the property sector that China is struggling to turn around. This, in turn, is weighing on households, causing them to consume less as they observe the assets that hold most of their wealth declining in value. With Beijing set on increasing consumption's contribution to GDP growth in 2026, economists expect that consumers will either need to see the property downturn turn around, or for Beijing to unleash more serious stimulus measures, to meaningfully boost consumption.
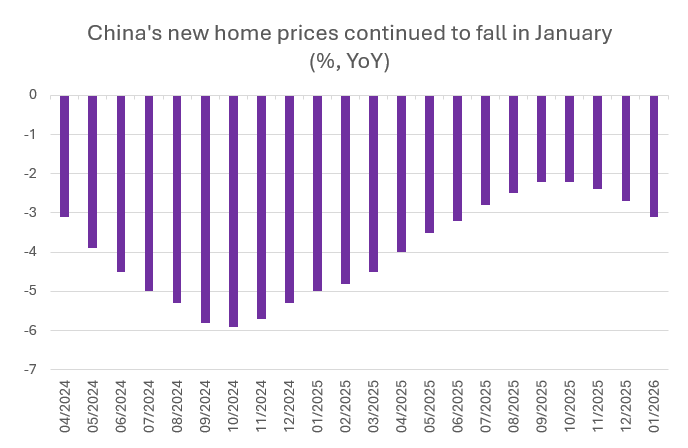
Source: Bloomberg, BIL
In terms of price pressures, China’s annual inflation rate fell sharply to 0.2% in January, down from 0.8% the previous month and below expectations. This is the lowest rate since October last year. Prices fell for pork, eggs and cooking oils, which pushed down food inflation for the first time in three months. Non-food inflation also slowed, despite ongoing consumer trade-in programmes. Meanwhile, core inflation, excluding food and energy, eased to 0.8% year-on-year, which is the weakest figure in six months, following increases of 1.2% in December and November.
UK economy grew by just 0.1% in Q4 2025
According to preliminary estimates, the British economy expanded by just 0.1% in the final quarter of 2025, falling short of expectations and bringing to a close a year of modest growth.
Growth was driven higher by industrial production and manufacturing, which offset a decline in construction output. Services remained unchanged in Q4, partly reflecting the uncertainty faced by businesses in the run-up to the Autumn Budget announcement. Consumer spending remained low, while trade continued to be a drag on growth. Business investment fell by 2.7%, while government consumption rose by 0.4%.
Despite Chancellor Reeves' attempts to improve stability and increase business investment, the economy continues to struggle. Overall, the UK economy expanded by 1.3% in 2025, which is below the Bank of England’s (BoE) estimate of 1.4%, up from 1.1% in 2024. The BoE is expecting just 0.9% growth this year.
With growth still depressed, the BoE is expected to continue lowering interest rates in an attempt to stimulate growth, with the first cut of the year likely to be made at the March meeting.
Calendar for the week ahead
Monday – Japan GDP Growth Rate (Prel, Q4). Switzerland GDP Growth Rate (Flash, Q4). Eurozone Industrial Production (December).
Tuesday – UK Unemployment Rate (December). Germany & Eurozone ZEW Economic Sentiment (February). US NAHB Housing Market Index (February).
Wednesday – Japan Balance of Trade (January). UK Inflation Rate (January). US Housing Starts (December), Industrial Production (January), FOMC Minutes.
Thursday – Switzerland Balance of Trade (January). US Balance of Trade (December), Jobless Claims. Eurozone Consumer Confidence (Flash, February).
Friday – Japan Inflation Rate (January). UK Retail Sales (January). France, Germany, Eurozone, UK, US Composite, Manufacturing & Services PMI (Flash, February). US GDP Growth Rate (Adv, Q4), Michigan Consumer Sentiment (Final, February).
Disclaimer
All financial data and/or economic information released by this Publication (the “Publication”); (the “Data” or the “Financial data
and/or economic information”), are provided for information purposes only,
without warranty of any kind, including without limitation the warranties of merchantability, fitness for a particular
purpose or warranties and non-infringement of any patent, intellectual property or proprietary rights of any party, and
are not intended for trading purposes. Banque Internationale à Luxembourg SA (the “Bank”) does not guarantee expressly or
impliedly, the sequence, accuracy, adequacy, legality, completeness, reliability, usefulness or timeless of any Data.
All Financial data and/or economic information provided may be delayed or may contain errors or be incomplete.
This disclaimer applies to both isolated and aggregate uses of the Data. All Data is provided on an “as is” basis. None of
the Financial data and/or economic information contained on this Publication constitutes a solicitation, offer, opinion, or
recommendation, a guarantee of results, nor a solicitation by the Bank of an offer to buy or sell any security, products and
services mentioned into it or to make investments. Moreover, none of the Financial data and/or economic information contained on
this Publication provides legal, tax accounting, financial or investment advice or services regarding the profitability or
suitability of any security or investment. This Publication has not been prepared with the aim to take an investor’s particular investment objectives,
financial position or needs into account. It is up to the investor himself to consider whether the Data contained herein this
Publication is appropriate to his needs, financial position and objectives or to seek professional independent advice before making
an investment decision based upon the Data. No investment decision whatsoever may result from solely reading this document. In order
to read and understand the Financial data and/or economic information included in this document, you will need to have knowledge and
experience of financial markets. If this is not the case, please contact your relationship manager. This Publication is prepared by
the Bank and is based on data available to the public and upon information from sources believed to be reliable and accurate, taken from
stock exchanges and third parties. The Bank, including its parent,- subsidiary or affiliate entities, agents, directors, officers,
employees, representatives or suppliers, shall not, directly or indirectly, be liable, in any way, for any: inaccuracies or errors
in or omissions from the Financial data and/or economic information, including but not limited to financial data regardless of the
cause of such or for any investment decision made, action taken, or action not taken of whatever nature in reliance upon any Data
provided herein, nor for any loss or damage, direct or indirect, special or consequential, arising from any use of this Publication
or of its content. This Publication is only valid at the moment of its editing, unless otherwise specified. All Financial data and/or
economic information contained herein can also quickly become out-of- date. All Data is subject to change without notice and may not be
incorporated in any new version of this Publication. The Bank has no obligation to update this Publication upon the availability of new data,
the occurrence of new events and/or other evolutions. Before making an investment decision, the investor must read carefully the terms and
conditions of the documentation relating to the specific products or services. Past performance is no guarantee of future performance.
Products or services described in this Publication may not be available in all countries and may be subject to restrictions in some persons
or in some countries. No part of this Publication may be reproduced, distributed, modified, linked to or used for any public or commercial
purpose without the prior written consent of the Bank. In any case, all Financial data and/or economic information provided on this Publication
are not intended for use by, or distribution to, any person or entity in any jurisdiction or country where such use or distribution would be
contrary to law and/or regulation. If you have obtained this Publication from a source other than the Bank website, be aware that electronic
documentation can be altered subsequent to original distribution.
As economic conditions are subject to change, the information and opinions presented in this outlook are current only as of the date
indicated in the matrix or the publication date. This publication is based on data available to the public and upon information that is
considered as reliable. Even if particular attention has been paid to its content, no guarantee, warranty or representation is given to the
accuracy or completeness thereof. Banque Internationale à Luxembourg cannot be held liable or responsible with respect to the information
expressed herein. This document has been prepared only for information purposes and does not constitute an offer or invitation to make investments.
It is up to investors themselves to consider whether the information contained herein is appropriate to their needs and objectives or to seek advice
before making an investment decision based upon this information. Banque Internationale à Luxembourg accepts no liability whatsoever for any investment
decisions of whatever nature by the user of this publication, which are in any way based on this publication, nor for any loss or damage arising
from any use of this publication or its content. This publication, prepared by Banque Internationale à Luxembourg (BIL), may not be copied or
duplicated in any form whatsoever or redistributed without the prior written consent of BIL 69, route d’Esch ı L-2953 Luxembourg ı
RCS Luxembourg B-6307 ı Tel. +352 4590 6699 ı www.bil.com.
Read more