BIL INVESTMENT INSIGHTS

Market Snapshot
Last week, US President Donald Trump travelled to China to meet President Xi Jinping to discuss trade, technology restrictions, global tensions, and potential business deals. Although both sides presented the meeting as a success, with talk of increased Chinese purchases of US goods and a possible loosening of export restrictions, the actual outcomes were limited and largely preliminary. The biggest impact on markets was not new deals, but a reduction in geopolitical risk: investors interpreted the summit as reinforcing the fragile trade truce and reducing the likelihood of further escalation. However, equities were broadly flat, and the yuan weakened slightly after the summit, reflecting disappointment over the lack of concrete breakthroughs, as well as the continued influence of the conflict in the Middle East.
Following a tech-led rally throughout last week, major US stock indices ended lower as optimism surrounding AI-related stocks was offset by concerns about elevated oil prices, rising inflation, and ongoing geopolitical uncertainty. US Treasuries also fell last week as yields increased across the curve in response to higher-than-expected inflation data and oil prices above $110 per barrel. Yields on 10-year US Treasuries breached 4.6% intraday on Friday, and 30-year yields exceeded 5%, creating headwinds for risk assets.
The UK’s long-term borrowing costs (30-year Gilt yield) hit their highest level since 1998, as political uncertainty put pressure on both the stock and bond markets last week. Prime Minister Keir Starmer is under growing pressure to resign following significant losses by his Labour Party in regional elections. This has caused significant volatility in the bond market, with yields on 10-year UK government bonds reaching their highest level since 2008 on Friday, as traders factored in the increased likelihood of Andy Burnham (the current Mayor of Greater Manchester) challenging Starmer for the Labour Party leadership.
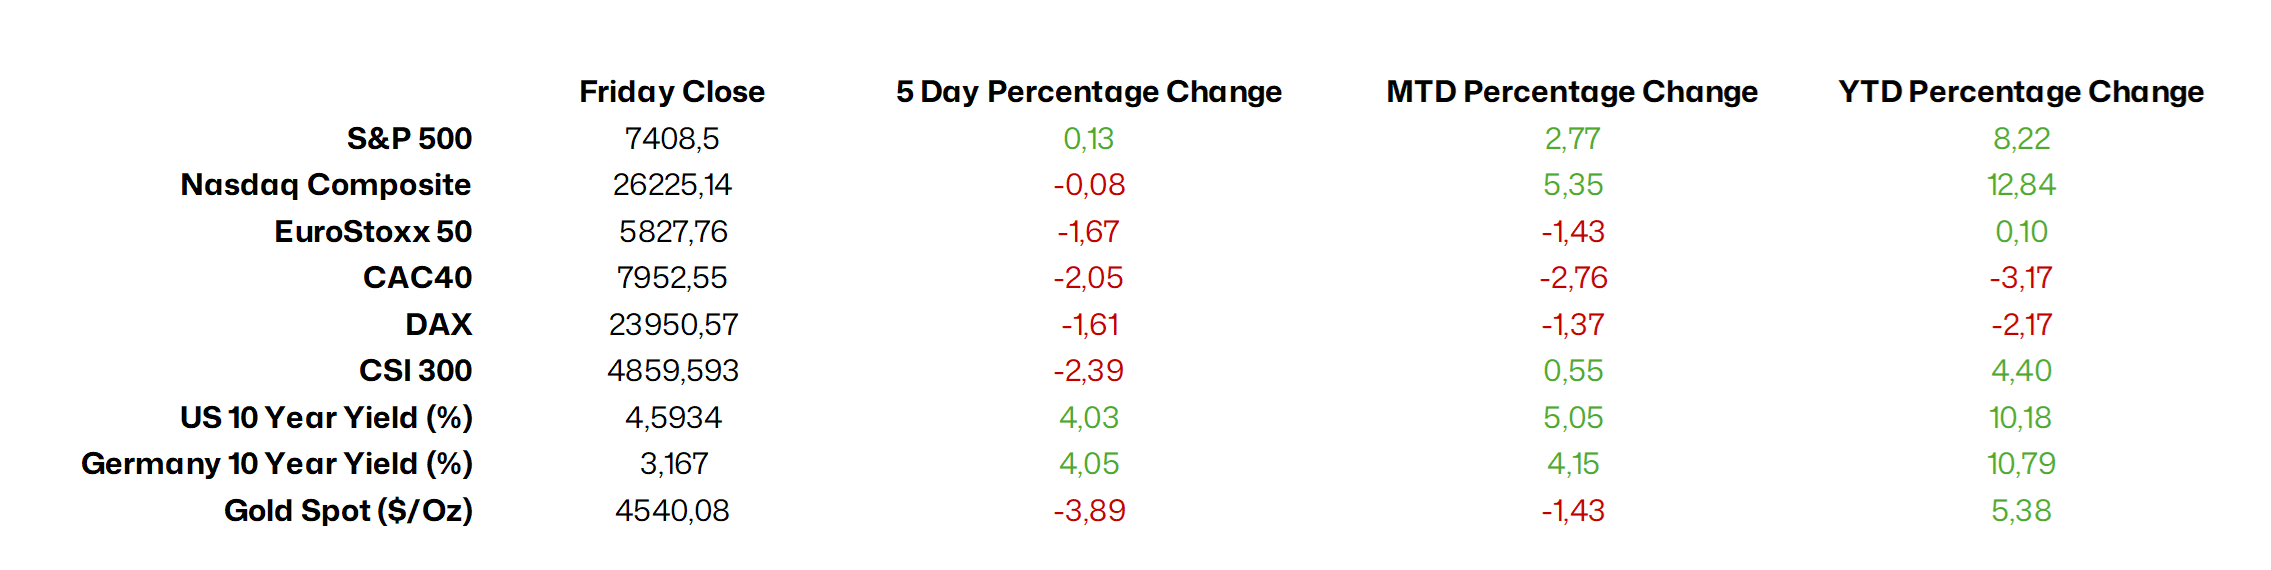
Source: Bloomberg, BIL as of May 18
Macro Snapshot
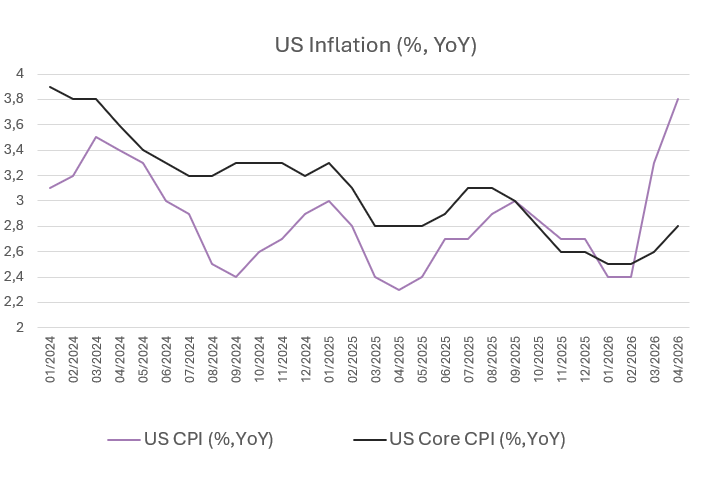
US inflation accelerates to 3.8%
Annual consumer price inflation in the US reached 3.8% in April – it’s highest level since May 2023, and up from 3.3% in March. Consensus estimates had expected a slightly lower 3.7%.
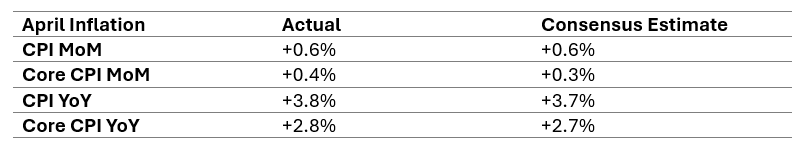
Source: Bloomberg, BIL
Food and energy push up headline inflation
Hotter prices are largely a byproduct of the ongoing war in the Middle East. With the Strait of Hormuz still effectively closed, energy costs jumped 17.9%, up from 12.5% in March, mostly due to gasoline (28.4% YoY) and fuel oil (54.3% YoY).
The headline was also pushed up by rising food prices (3.2% vs 2.7%). Notably, average ground beef retail prices surged to a record high, highlighting the persistent tightness of US cattle supplies. Looking at food more broadly, considering that roughly one-third of global seaborne trade in fertilizers typically passes through the Strait of Hormuz, shortages should continue to pressure grocery prices in the months ahead.
Higher core inflation will be an attention point for the Fed
The uptick in core inflation is worth attention; it rose from 2.6% to 2.8%, its highest level since September.
Part of this is due to a rise in shelter costs (3.3% vs 3% prior), caused by a statistical distortion stemming from last year’s government shutdown. No CPI data was collected in October, and as such, staff at the Bureau of Labour Statistics filed that month’s housing inflation as zero. Because the “owner’s equivalent rent” category is updated every six months, the figure was therefore artificially suppressed until April when that “zero” dropped out of the stats. Beyond this, economists expect that housing inflation will continue to cool as the year progresses, though the marginal reduction inflation coming from shelter is slowing.
Services costs also moved higher, rising 3.4% in April, the highest since September. Airfares are up 20.7% YoY, as surging jet fuel costs prompt price hikes.
Core goods prices, were unchanged thanks to a decline in new vehicle costs. In a sign that retail price hikes to compensate for trade tariffs are tapering off, some categories that are more exposed to tariffs, including clothing and toys, rose at a more moderate pace than in March.
In recent weeks, FOMC governors have shown increased concern about how the Iran war is impacting prices. The next monetary policy committee is scheduled for June 16-17, by when they will also have the May CPI report. As of now, markets have closed the door on the prospect of Fed easing.
To keep in mind is that even if a diplomatic solution was reached and the Strait of Hormuz were to reopen tomorrow, prices are likely to continue rising in the next few inflation reports as elevated energy and fuel costs bleed into other categories. However, with the labour market on a more fragile footing than it was in 2022, and pandemic excess savings gone, it will be more difficult for a wage-price spiral to take hold.
Source: Bloomberg, BIL
US consumers keep spending, for now
Retail sales in the US increased 0.5% MoM in April, in line with forecasts. Retail sales are not adjusted for inflation and as such, gasoline stations recorded the biggest increase (2.8%), reflecting price increases stemming from the war in Iran. Excluding gas stations, retail sales rose 0.3%, exhibiting strength other than in cars, clothing and furniture. Sales at food services & drinking places, the only services-related category in the data, rose 0.6%. Core retail sales excluding food services, auto dealers, building materials stores and gasoline stations, which are used to calculate GDP, increased 0.5%, following a 0.8% gain in March and above expectations of 0.4%.
Looking ahead, if gasoline prices remain elevated, we can expect that consumers will have to reduce spending on other goods and services to balance their pocketbooks. Thus, it is reasonable to expect a slowdown in sales in the coming months, unless gasoline and other energy prices retreat.
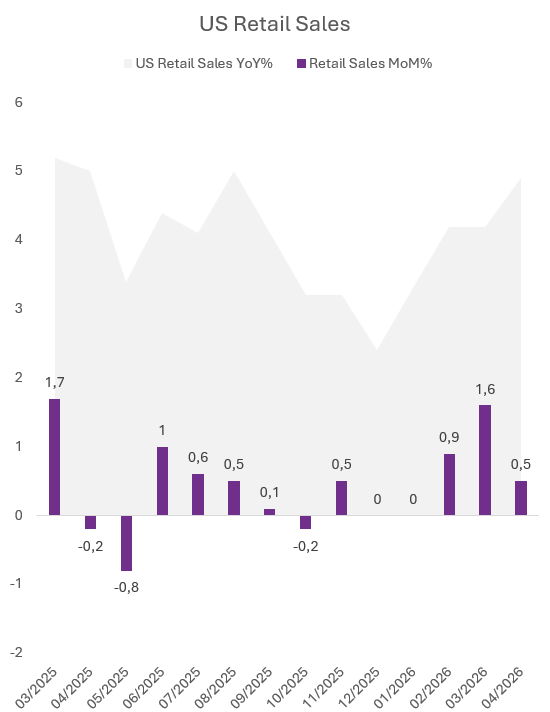
Source: Bloomberg, BIL
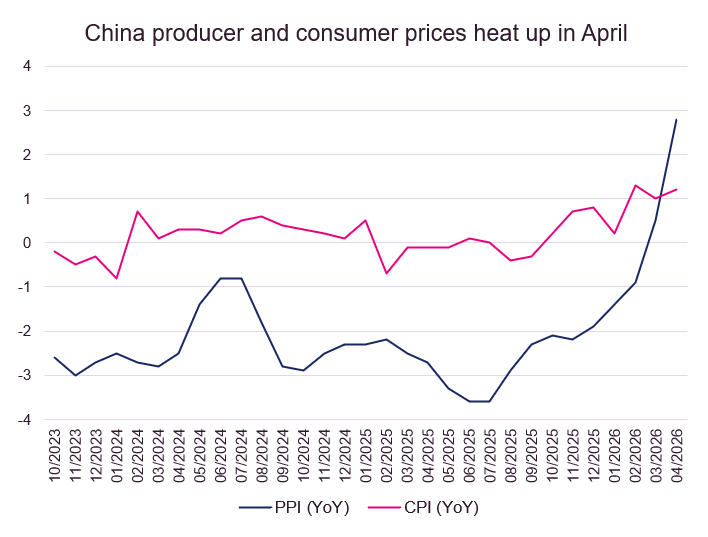
China producer and consumer prices heat up
The war in the Middle East and soaring energy prices are seeping into the Chinese economy, with both producer and consumer prices heating up in April. After rising for the first time since September 2023 in March (+0.5%), producer prices accelerated to 2.8% year on year in April, marking the fastest growth since July 2022. This increase was fueled by rising prices in sectors such as non‑ferrous metals, oil and gas, and tech equipment. Beijing’s efforts to cut excess industrial capacity and curb intense price competition, has also helped lift factory‑gate prices.
Consumer prices also rose in April, increasing to 1.2% year on year, compared with 1% in March, driven by higher prices for gasoline and gold jewellery. Non‑food inflation picked up, with transport costs rising significantly (4.6% vs 0.9%) amid higher energy prices and supply chain disruptions linked to the conflict in the Middle East. Meanwhile, food prices declined by 1.6%, with pork prices down 15.2%. Core inflation, which excludes volatile categories such as food and energy, rose to 1.2% year on year, up from 1.1% in the previous month.
Higher living costs risk further dampening household demand, which has remained sluggish amid a slowdown in overall economic growth and the ongoing real estate crisis.
The renewed price pressures from higher energy costs are externally driven and do not reflect stronger domestic demand. As a result, they offer limited support to policymakers’ goal of boosting consumption and reversing deflation. At the same time, higher prices are putting pressure on manufacturers, who are already struggling to pass through rising input costs in a weak demand environment.
Despite this, China’s significant energy reserves and diversified supply mix place it in a relatively strong position to navigate ongoing disruptions. In addition, resilient exports (+14% in April) continue to support the economy, as demand for AI‑related goods remains solid.
Source: Bloomberg, BIL
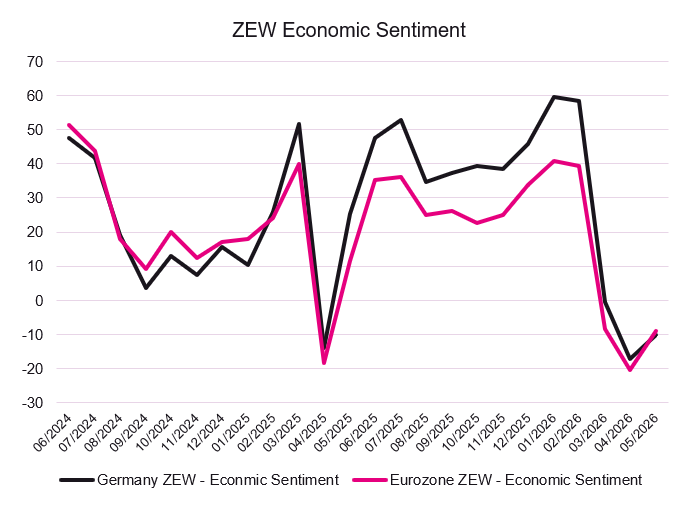
Eurozone sentiment improves on hopes for conflict resolution
ZEW economic sentiment improved in May for both the Euro Area and Germany, exceeding expectations and reflecting more optimistic forward-looking views despite ongoing uncertainties. In the Euro Area, sentiment rose by 11.3 points to -9.1, supported by market hopes of a quick resolution to the Iran conflict, while a majority of analysts (51.1%) expect no change in activity. Interestingly, inflation expectations declined by 13.7 points to 65.3.
In Germany, sentiment increased by 7 points to -10.2 from a more than three-year low, although the outlook remains tempered by weak industrial production and rising energy prices. Any recovery in 2H 2026, will hinge on easing geopolitical tensions and effective policy support. Sectoral trends were mixed, with improvements in IT, construction, and metals, but continued weakness in autos and mechanical engineering.
Source: Bloomberg, BIL
Calendar for the week ahead
Monday – China House Price Index, Industrial Production, Retail Sales, Fixed Asset Investment, Unemployment Rate (April). Switzerland GDP Growth Rate (Flash, Q1).
Tuesday – Japan GDP Growth Rate (Prel, Q1). UK Unemployment Rate (March). Eurozone Balance of Trade (March).
Wednesday – UK Inflation Rate (April). Eurozone Inflation Rate (Final, April).
Thursday – Japan Balance of Trade (April). Eurozone, UK & US Composite, Manufacturing and Services PMIs (Flash, May). US Housing Stats, Jobless Claims. Eurozone Consumer Confidence (Flash, May).
Friday – UK Consumer Confidence (May). Japan Inflation Rate (April). Germany Consumer Confidence (June). UK Retail Sales (April). US Michigan Consumer Sentiment (Final, May). Eurozone Negotiated Wage Growth (Q1).
Disclaimer
All financial data and/or economic information released by this Publication (the “Publication”); (the “Data” or the “Financial data
and/or economic information”), are provided for information purposes only,
without warranty of any kind, including without limitation the warranties of merchantability, fitness for a particular
purpose or warranties and non-infringement of any patent, intellectual property or proprietary rights of any party, and
are not intended for trading purposes. Banque Internationale à Luxembourg SA (the “Bank”) does not guarantee expressly or
impliedly, the sequence, accuracy, adequacy, legality, completeness, reliability, usefulness or timeless of any Data.
All Financial data and/or economic information provided may be delayed or may contain errors or be incomplete.
This disclaimer applies to both isolated and aggregate uses of the Data. All Data is provided on an “as is” basis. None of
the Financial data and/or economic information contained on this Publication constitutes a solicitation, offer, opinion, or
recommendation, a guarantee of results, nor a solicitation by the Bank of an offer to buy or sell any security, products and
services mentioned into it or to make investments. Moreover, none of the Financial data and/or economic information contained on
this Publication provides legal, tax accounting, financial or investment advice or services regarding the profitability or
suitability of any security or investment. This Publication has not been prepared with the aim to take an investor’s particular investment objectives,
financial position or needs into account. It is up to the investor himself to consider whether the Data contained herein this
Publication is appropriate to his needs, financial position and objectives or to seek professional independent advice before making
an investment decision based upon the Data. No investment decision whatsoever may result from solely reading this document. In order
to read and understand the Financial data and/or economic information included in this document, you will need to have knowledge and
experience of financial markets. If this is not the case, please contact your relationship manager. This Publication is prepared by
the Bank and is based on data available to the public and upon information from sources believed to be reliable and accurate, taken from
stock exchanges and third parties. The Bank, including its parent,- subsidiary or affiliate entities, agents, directors, officers,
employees, representatives or suppliers, shall not, directly or indirectly, be liable, in any way, for any: inaccuracies or errors
in or omissions from the Financial data and/or economic information, including but not limited to financial data regardless of the
cause of such or for any investment decision made, action taken, or action not taken of whatever nature in reliance upon any Data
provided herein, nor for any loss or damage, direct or indirect, special or consequential, arising from any use of this Publication
or of its content. This Publication is only valid at the moment of its editing, unless otherwise specified. All Financial data and/or
economic information contained herein can also quickly become out-of- date. All Data is subject to change without notice and may not be
incorporated in any new version of this Publication. The Bank has no obligation to update this Publication upon the availability of new data,
the occurrence of new events and/or other evolutions. Before making an investment decision, the investor must read carefully the terms and
conditions of the documentation relating to the specific products or services. Past performance is no guarantee of future performance.
Products or services described in this Publication may not be available in all countries and may be subject to restrictions in some persons
or in some countries. No part of this Publication may be reproduced, distributed, modified, linked to or used for any public or commercial
purpose without the prior written consent of the Bank. In any case, all Financial data and/or economic information provided on this Publication
are not intended for use by, or distribution to, any person or entity in any jurisdiction or country where such use or distribution would be
contrary to law and/or regulation. If you have obtained this Publication from a source other than the Bank website, be aware that electronic
documentation can be altered subsequent to original distribution.
As economic conditions are subject to change, the information and opinions presented in this outlook are current only as of the date
indicated in the matrix or the publication date. This publication is based on data available to the public and upon information that is
considered as reliable. Even if particular attention has been paid to its content, no guarantee, warranty or representation is given to the
accuracy or completeness thereof. Banque Internationale à Luxembourg cannot be held liable or responsible with respect to the information
expressed herein. This document has been prepared only for information purposes and does not constitute an offer or invitation to make investments.
It is up to investors themselves to consider whether the information contained herein is appropriate to their needs and objectives or to seek advice
before making an investment decision based upon this information. Banque Internationale à Luxembourg accepts no liability whatsoever for any investment
decisions of whatever nature by the user of this publication, which are in any way based on this publication, nor for any loss or damage arising
from any use of this publication or its content. This publication, prepared by Banque Internationale à Luxembourg (BIL), may not be copied or
duplicated in any form whatsoever or redistributed without the prior written consent of BIL 69, route d’Esch ı L-2953 Luxembourg ı
RCS Luxembourg B-6307 ı Tel. +352 4590 6699 ı www.bil.com.
Read more