BIL INVESTMENT INSIGHTS

Key takeaways:
- Missing the market’s best days can significantly reduce long-term returns
- The best days often occur in periods of stress rather than stability
- Staying invested consistently has proven more effective than trying to time the market’s ups and downs
- Market volatility is unsettling, but it is a normal and unavoidable part of long‑term investing
The Temptation to Jump Ship
One of the toughest challenges for investors is staying invested during periods of uncertainty. Faced with the concerning situation in the Middle East, and the ever-beating drum of ominous news, it is natural that investor anxiety is currently high. In times like these, some might be compelled to step out of the market, reduce exposure, or wait for conditions to “feel” more safe.
However, exiting the market during volatile periods often means crystallising losses and missing the rebound. History shows that investors who react emotionally to short‑term news tend to underperform those who stay disciplined and maintain their long‑term investment strategy.
Missing the market’s best days can be costly
If investors step out of the market during volatile periods, they risk missing the powerful recovery days that are difficult to predict, but which have an outsized impact on long-term returns.
This is illustrated in the next chart. If one had invested $10,000 in the S&P 500 in 2006 and left it there, the amount would have grown to over $80,000 by 2025.
Missing just 10 of the best days cuts that amount by more than half.
Missing 40 of the best days leaves the investor with less than the original amount invested.
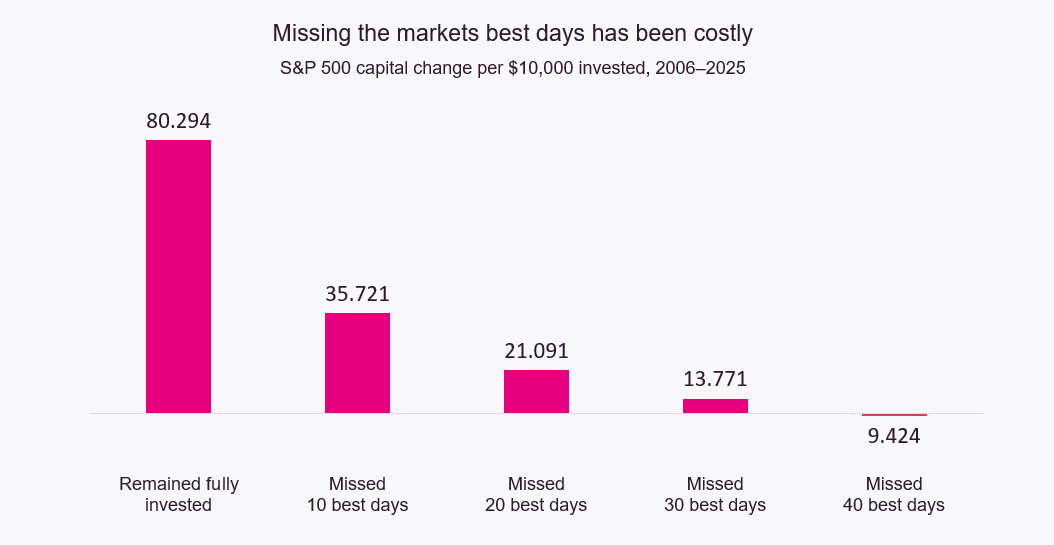
Past performance is no guarantee of future returns. Source: Bloomberg, BIL. The S&P 500 Index is a market capitalization–weighted index of 500 common stocks chosen for market size, liquidity, and industry group representation. You cannot invest directly in an index.
When do the best days occur?
The crux is that the majority of the market’s strongest single‑day gains occur during periods of stress rather than stability. In fact, 64% of the S&P 500’s best days between 2007 and 2026 happened during bear markets, when uncertainty was high. A further 16% occurred in the first two months of a new bull market, when conditions still felt fragile. Only 20% of the best days took place during the more comfortable, established phases of a bull market.
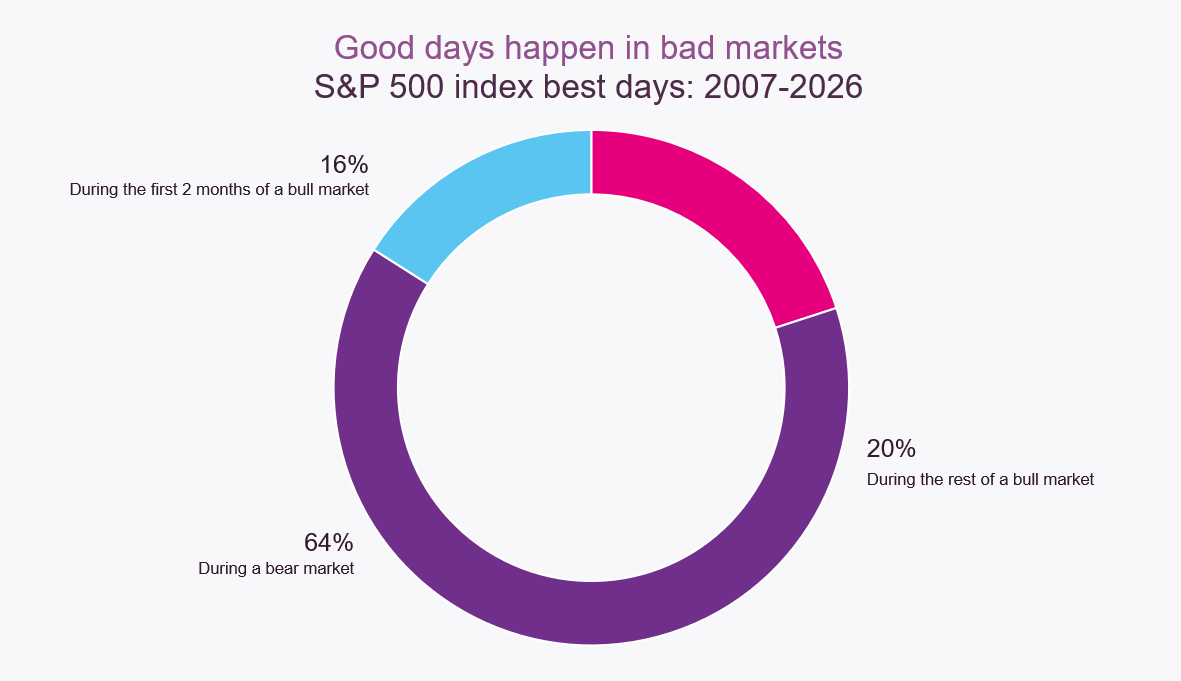
Past performance is no guarantee of future returns. Source: Bloomberg, BIL. Based on the 50 best days. The S&P 500 Index is a market capitalization–weighted index of 500 common stocks chosen for market size, liquidity, and industry group representation. You cannot invest directly in an index.
Because the best market days often occur soon after the worst ones, investors who exit to “avoid losses” frequently miss the recovery. For this reason, we often hear that time in the market – rather than trying to time the market – is a more reliable path to building long-term wealth.
Time in the market is preferable to timing the market
Market downturns can be disconcerting, but they have also historically proven temporary. Across the course of the past century, markets have grappled with an array of global crises including World Wars, the 2008 Financial Crisis, 9/11, and the Covid-19 Pandemic that brought the global economy to a virtual standstill.
Market downturns can be disconcerting, but they have also historically proven temporary. Across the course of the past century, markets have grappled with an array of global crises including World Wars, the 2008 Financial Crisis, 9/11, and the Covid-19 Pandemic that brought the global economy to a virtual standstill.
S&P 500 Historical Performance
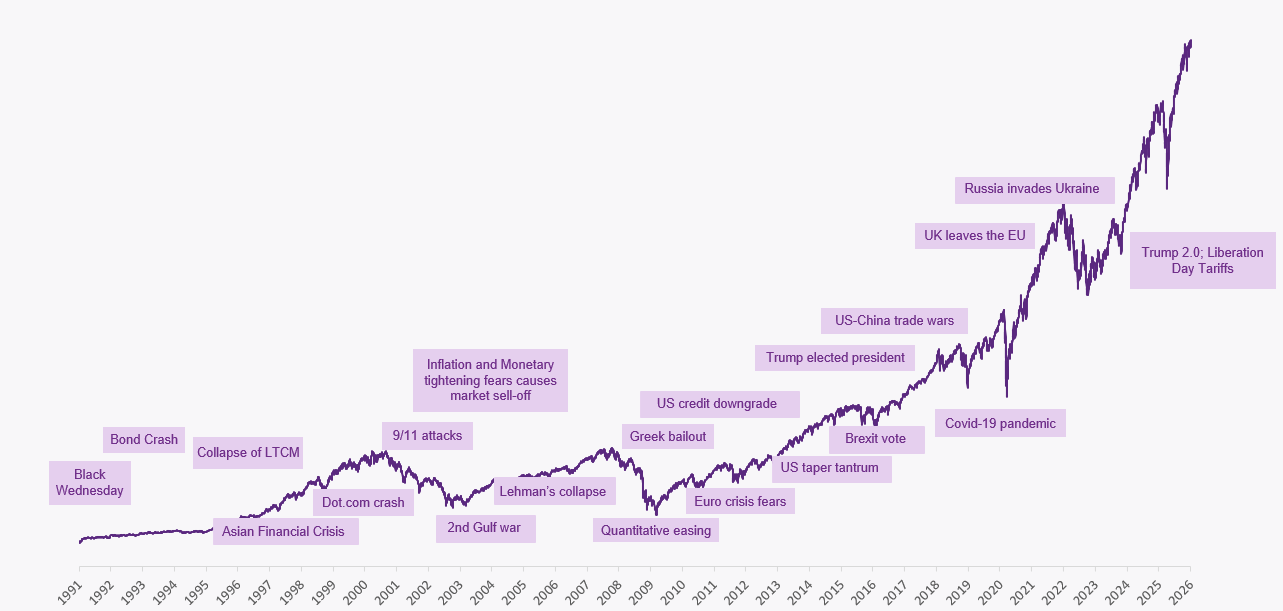
Past performance is no guarantee of future returns. Source: Bloomberg, BIL. The S&P 500 Index is a market cap–weighted index of 500 common stocks chosen for market size, liquidity, and industry group representation. You cannot invest directly in an index.
But long‑term investors who remained invested through these shocks benefited from strong subsequent recoveries. Since 1991, the starting point in our chart, the inflation‑adjusted total return of the S&P 500 (including reinvested dividends) has been around 8.5% per year. Periods of drawdown are emotionally challenging, but they are typically shorter than the expansionary phases that follow.
Conclusion
Market volatility can be uncomfortable, especially in times of global uncertainty. But history shows that staying invested, remaining diversified, and avoiding reactionary decisions is often the most rewarding path for long-term investors.
Founded in 1856, BIL is the oldest private bank in the Grand Duchy. Having stood beside our clients for generations, we know that great things are built over time. With regard to investing, we also think in decades, not days, and our objective – and perhaps even our duty - is to help our clients realise the beauty of being invested long-term. This means helping clients:
- harness the powerful force of compounding to build wealth over time
- cut through the noise and information overload and stay focused on their long-term investment objectives
- resist the urge to capitulate in tough moments, helping them navigate the various stages of the cycle through diversification and by making tactical shifts between the multiple asset classes that we cover
Disclaimer
All financial data and/or economic information released by this Publication (the “Publication”); (the “Data” or the “Financial data
and/or economic information”), are provided for information purposes only,
without warranty of any kind, including without limitation the warranties of merchantability, fitness for a particular
purpose or warranties and non-infringement of any patent, intellectual property or proprietary rights of any party, and
are not intended for trading purposes. Banque Internationale à Luxembourg SA (the “Bank”) does not guarantee expressly or
impliedly, the sequence, accuracy, adequacy, legality, completeness, reliability, usefulness or timeless of any Data.
All Financial data and/or economic information provided may be delayed or may contain errors or be incomplete.
This disclaimer applies to both isolated and aggregate uses of the Data. All Data is provided on an “as is” basis. None of
the Financial data and/or economic information contained on this Publication constitutes a solicitation, offer, opinion, or
recommendation, a guarantee of results, nor a solicitation by the Bank of an offer to buy or sell any security, products and
services mentioned into it or to make investments. Moreover, none of the Financial data and/or economic information contained on
this Publication provides legal, tax accounting, financial or investment advice or services regarding the profitability or
suitability of any security or investment. This Publication has not been prepared with the aim to take an investor’s particular investment objectives,
financial position or needs into account. It is up to the investor himself to consider whether the Data contained herein this
Publication is appropriate to his needs, financial position and objectives or to seek professional independent advice before making
an investment decision based upon the Data. No investment decision whatsoever may result from solely reading this document. In order
to read and understand the Financial data and/or economic information included in this document, you will need to have knowledge and
experience of financial markets. If this is not the case, please contact your relationship manager. This Publication is prepared by
the Bank and is based on data available to the public and upon information from sources believed to be reliable and accurate, taken from
stock exchanges and third parties. The Bank, including its parent,- subsidiary or affiliate entities, agents, directors, officers,
employees, representatives or suppliers, shall not, directly or indirectly, be liable, in any way, for any: inaccuracies or errors
in or omissions from the Financial data and/or economic information, including but not limited to financial data regardless of the
cause of such or for any investment decision made, action taken, or action not taken of whatever nature in reliance upon any Data
provided herein, nor for any loss or damage, direct or indirect, special or consequential, arising from any use of this Publication
or of its content. This Publication is only valid at the moment of its editing, unless otherwise specified. All Financial data and/or
economic information contained herein can also quickly become out-of- date. All Data is subject to change without notice and may not be
incorporated in any new version of this Publication. The Bank has no obligation to update this Publication upon the availability of new data,
the occurrence of new events and/or other evolutions. Before making an investment decision, the investor must read carefully the terms and
conditions of the documentation relating to the specific products or services. Past performance is no guarantee of future performance.
Products or services described in this Publication may not be available in all countries and may be subject to restrictions in some persons
or in some countries. No part of this Publication may be reproduced, distributed, modified, linked to or used for any public or commercial
purpose without the prior written consent of the Bank. In any case, all Financial data and/or economic information provided on this Publication
are not intended for use by, or distribution to, any person or entity in any jurisdiction or country where such use or distribution would be
contrary to law and/or regulation. If you have obtained this Publication from a source other than the Bank website, be aware that electronic
documentation can be altered subsequent to original distribution.
As economic conditions are subject to change, the information and opinions presented in this outlook are current only as of the date
indicated in the matrix or the publication date. This publication is based on data available to the public and upon information that is
considered as reliable. Even if particular attention has been paid to its content, no guarantee, warranty or representation is given to the
accuracy or completeness thereof. Banque Internationale à Luxembourg cannot be held liable or responsible with respect to the information
expressed herein. This document has been prepared only for information purposes and does not constitute an offer or invitation to make investments.
It is up to investors themselves to consider whether the information contained herein is appropriate to their needs and objectives or to seek advice
before making an investment decision based upon this information. Banque Internationale à Luxembourg accepts no liability whatsoever for any investment
decisions of whatever nature by the user of this publication, which are in any way based on this publication, nor for any loss or damage arising
from any use of this publication or its content. This publication, prepared by Banque Internationale à Luxembourg (BIL), may not be copied or
duplicated in any form whatsoever or redistributed without the prior written consent of BIL 69, route d’Esch ı L-2953 Luxembourg ı
RCS Luxembourg B-6307 ı Tel. +352 4590 6699 ı www.bil.com.
Read more
More
March 30, 2026
Weekly Investment Insights
Kindly note that our Weekly Insights will pause over the upcoming bank holiday weekend. Market Snapshot The conflict in the Middle East has now extended...
March 23, 2026
Weekly InsightsWeekly Investment Insight
Equities and bonds extended declines last week as investors grew increasingly concerned about the prospect of a prolonged energy shock, following renewed attacks on key...
March 16, 2026
Weekly InsightsWeekly Investment Insights
Market Snapshot The ongoing conflict in the Middle East continued to push oil prices higher last week, with Brent crude briefly rising to $106 per...
March 16, 2026
NewsOil shock sparks memories of the 2022...
Written on March 12 2026 After a weak 2025, when global supply far exceeded demand, oil markets have been thrown into turmoil as the...